Financial Planning & Analysis
Advanced FP&A tool that generates 5-year projected balance sheets and income statements for enhanced decision-making. Provides cash flow projections with loan-level amortization and models interest income based on user-defined stress scenarios.
FP&A Features
Comprehensive Tools And Analytics For Enhanced Profitability, Capital Efficiency, And Strategic Decision-Making
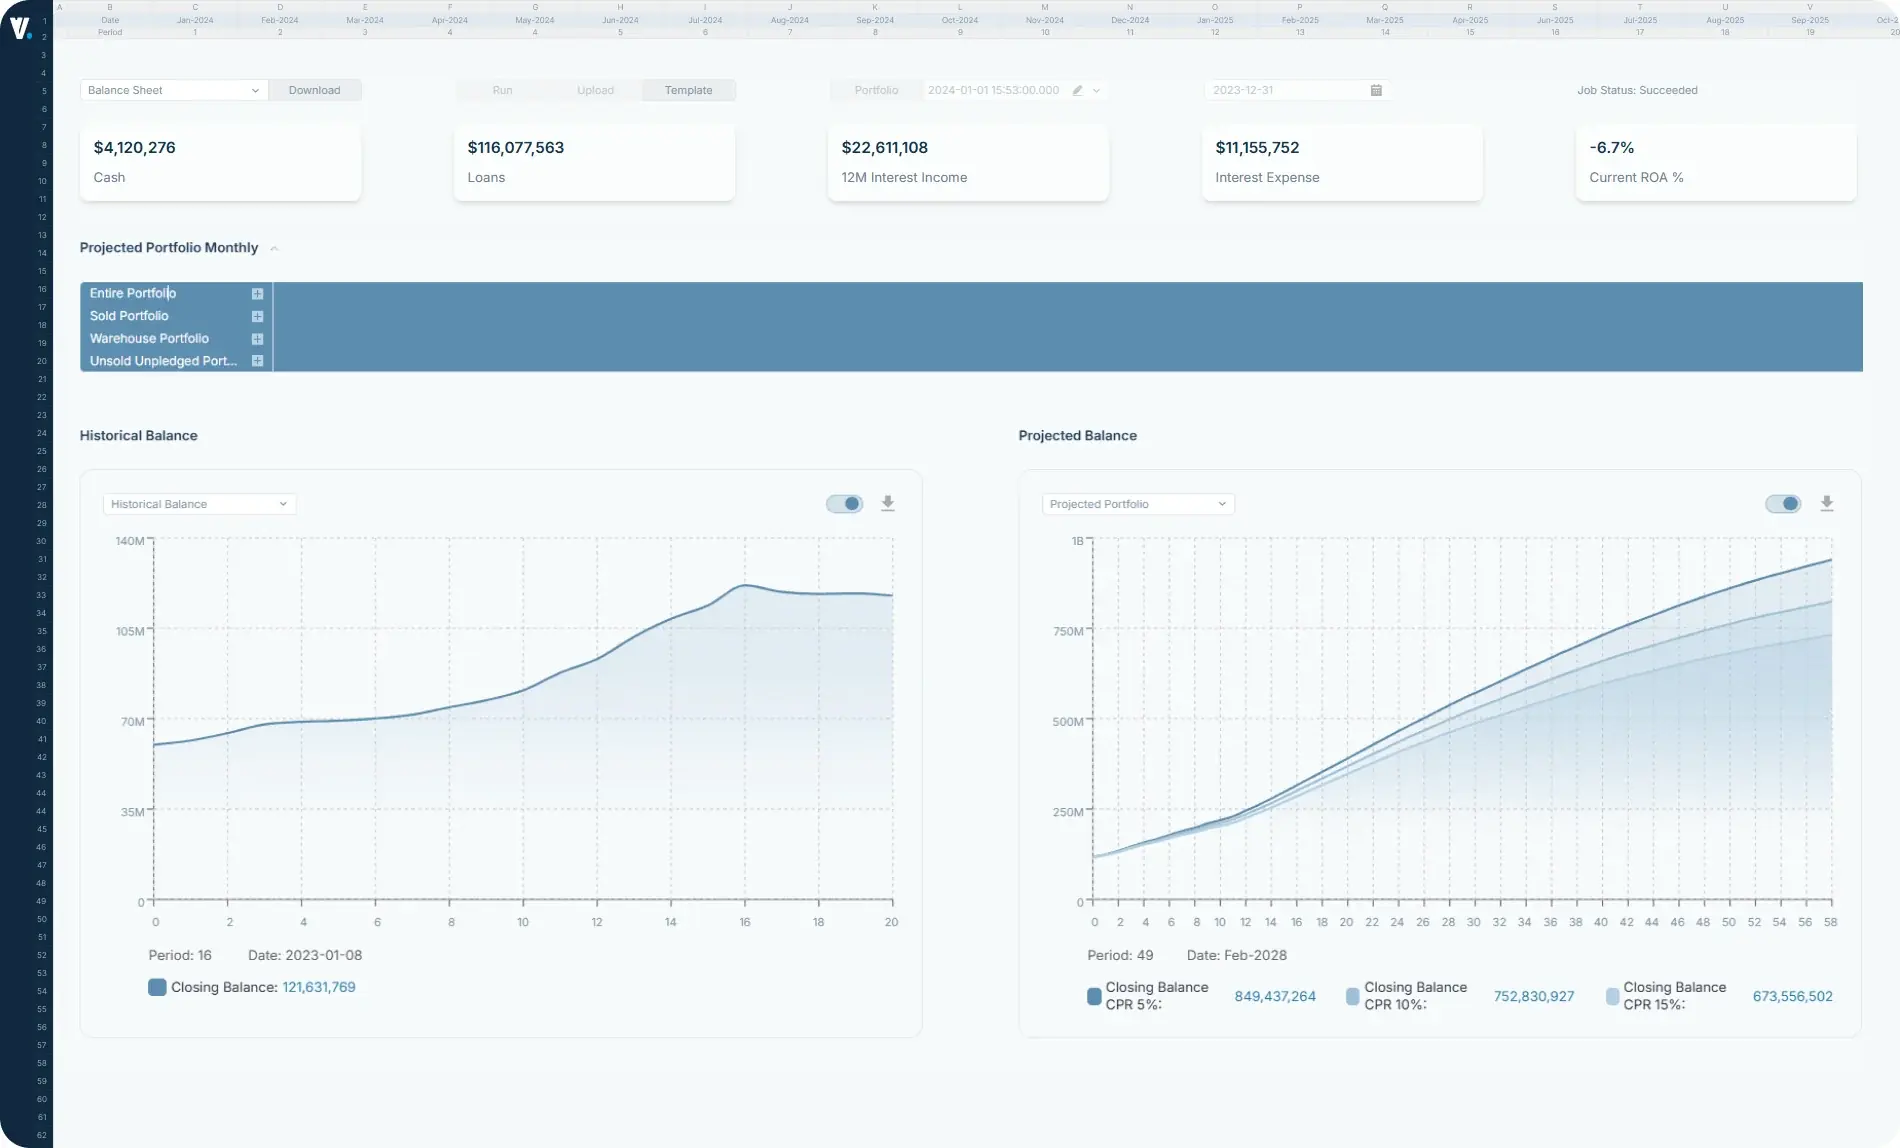
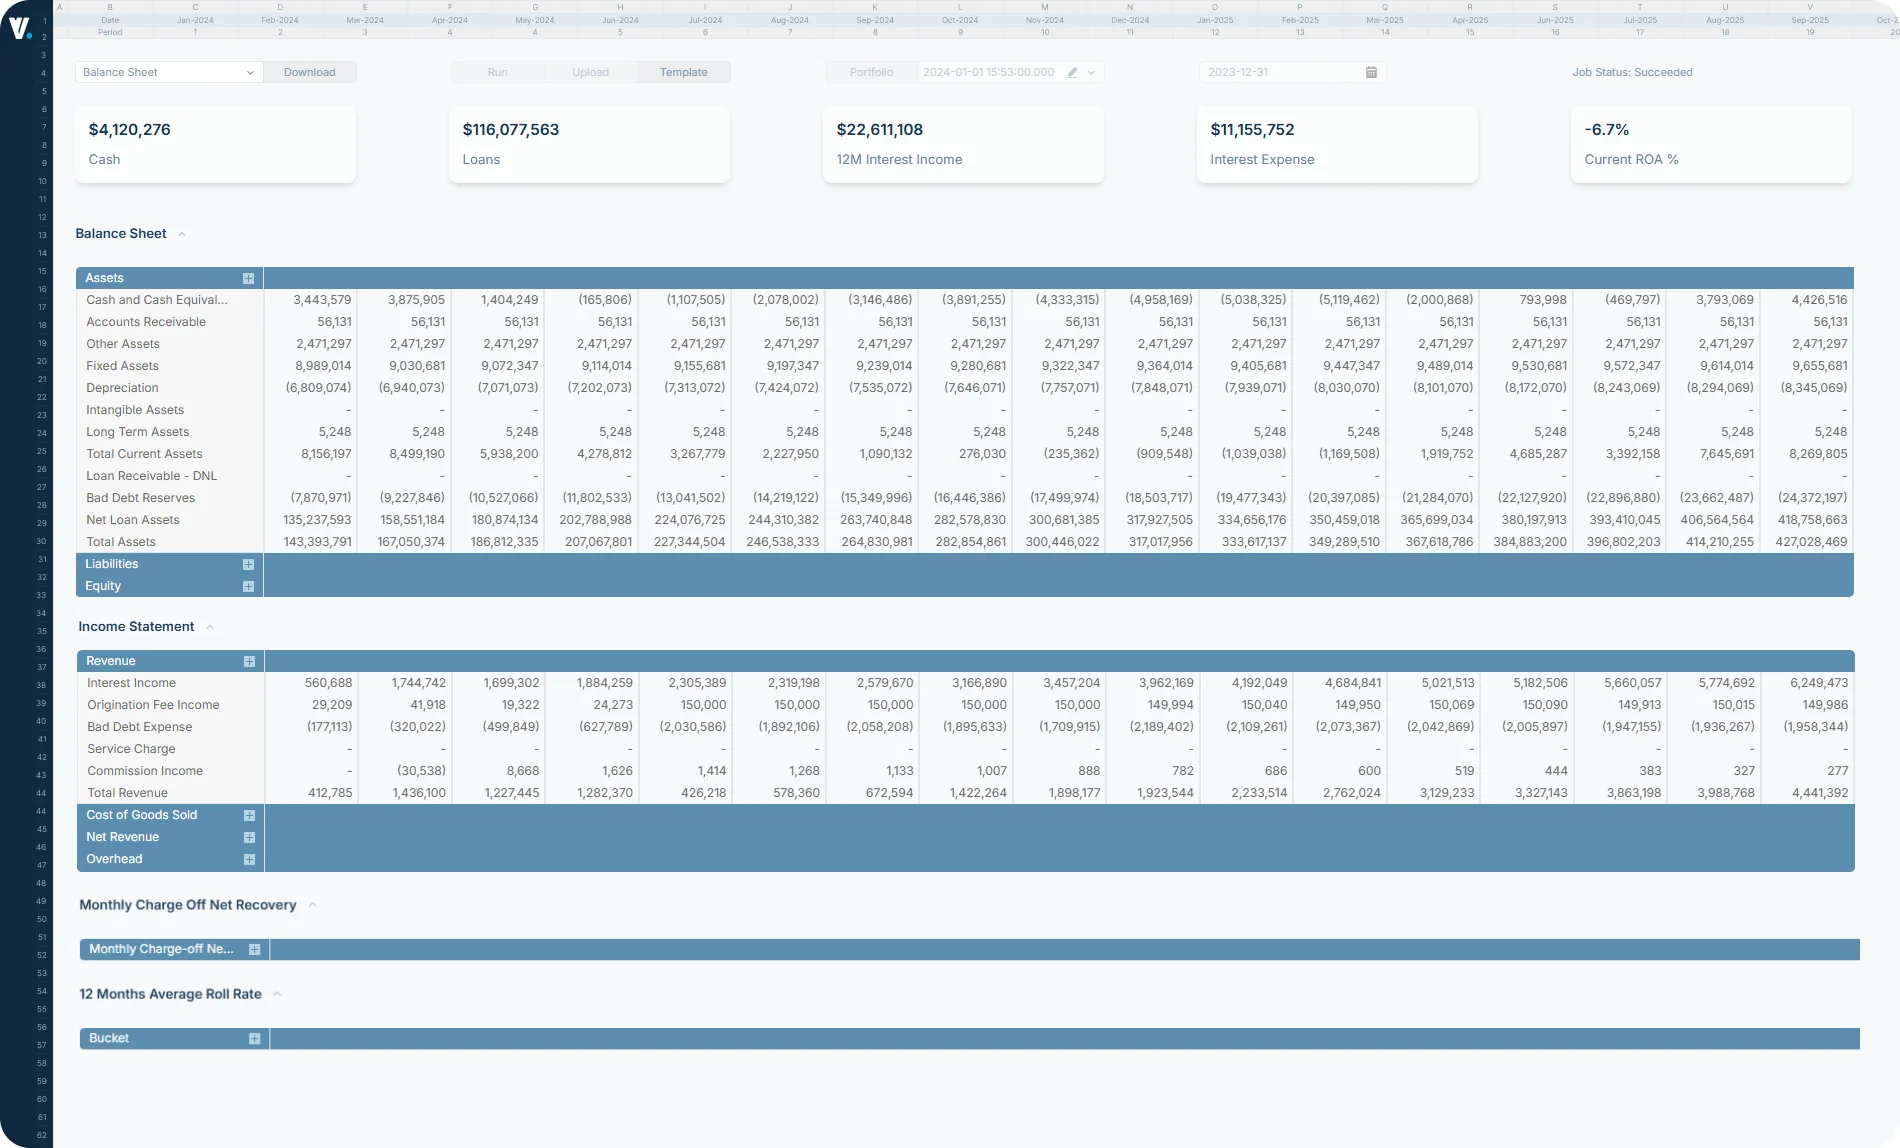
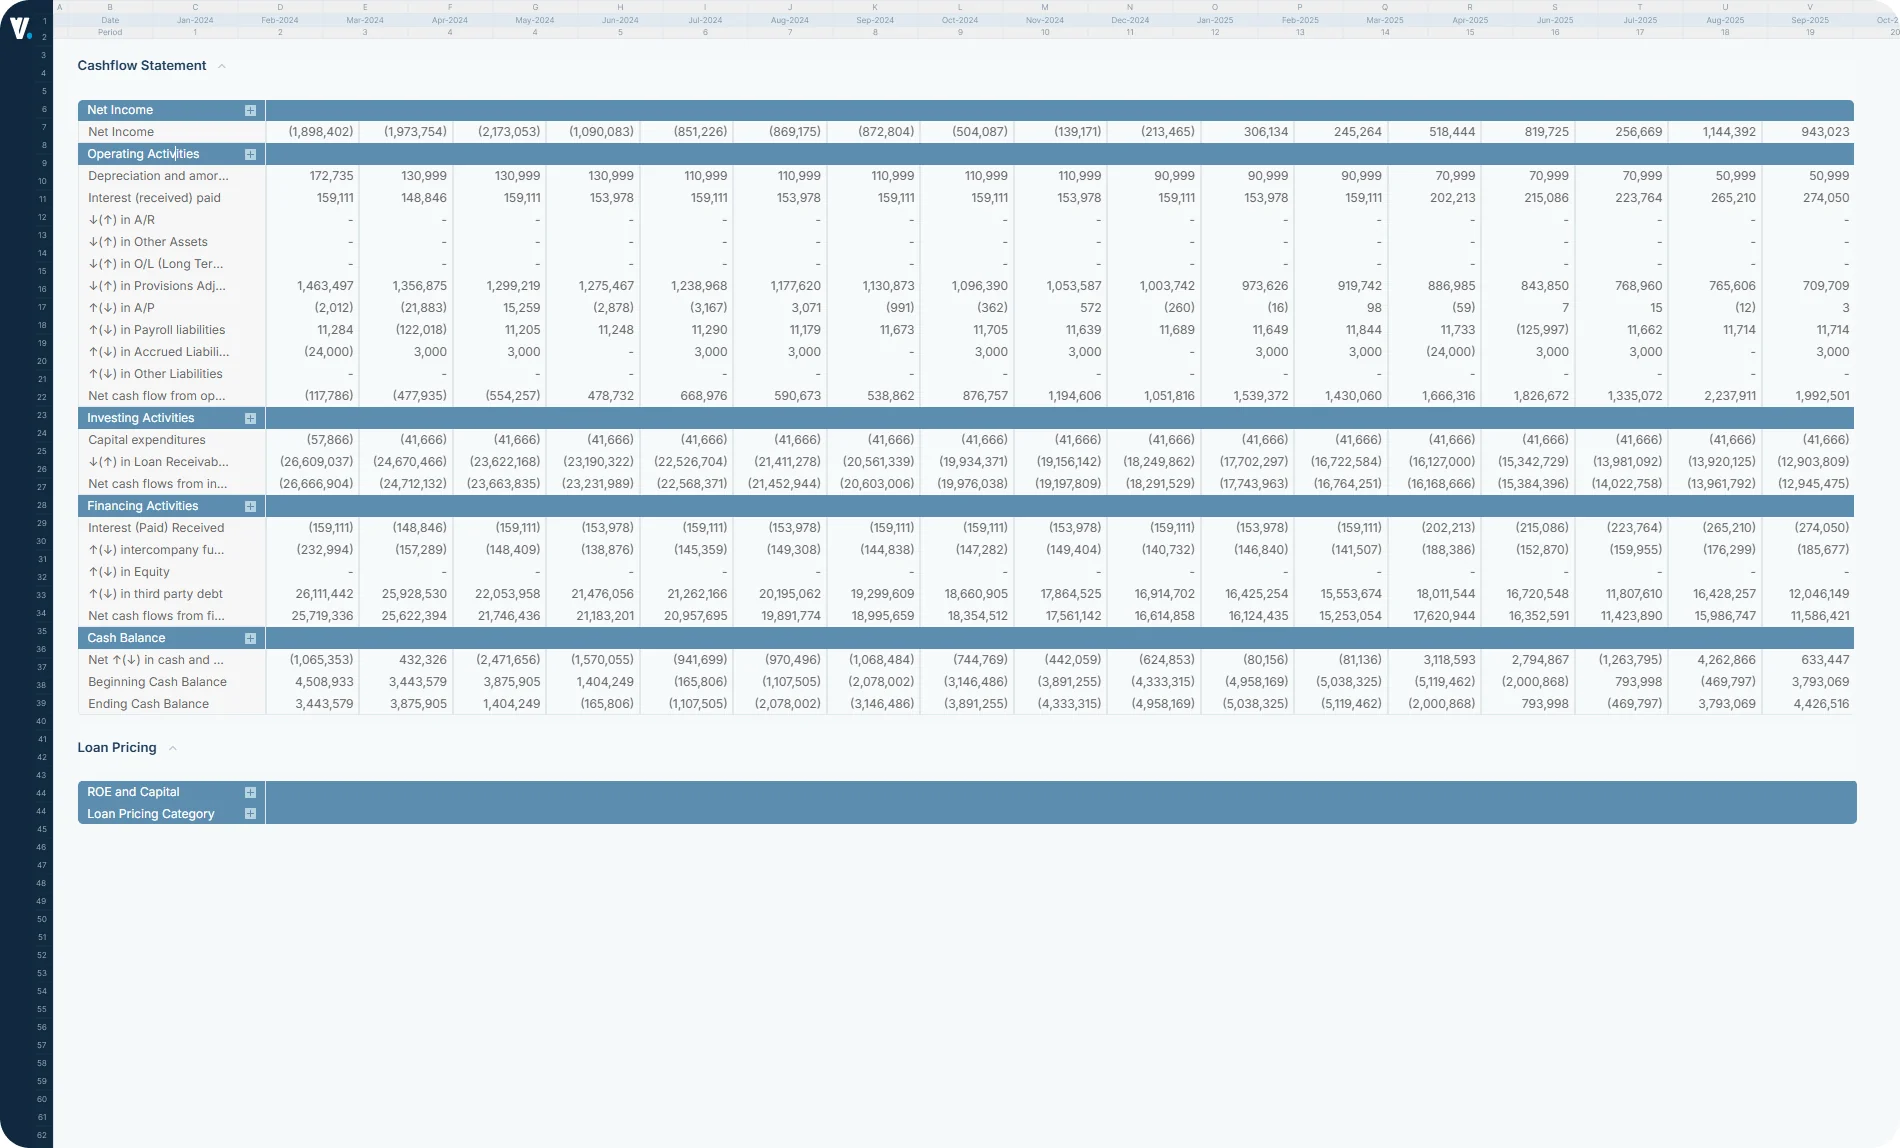
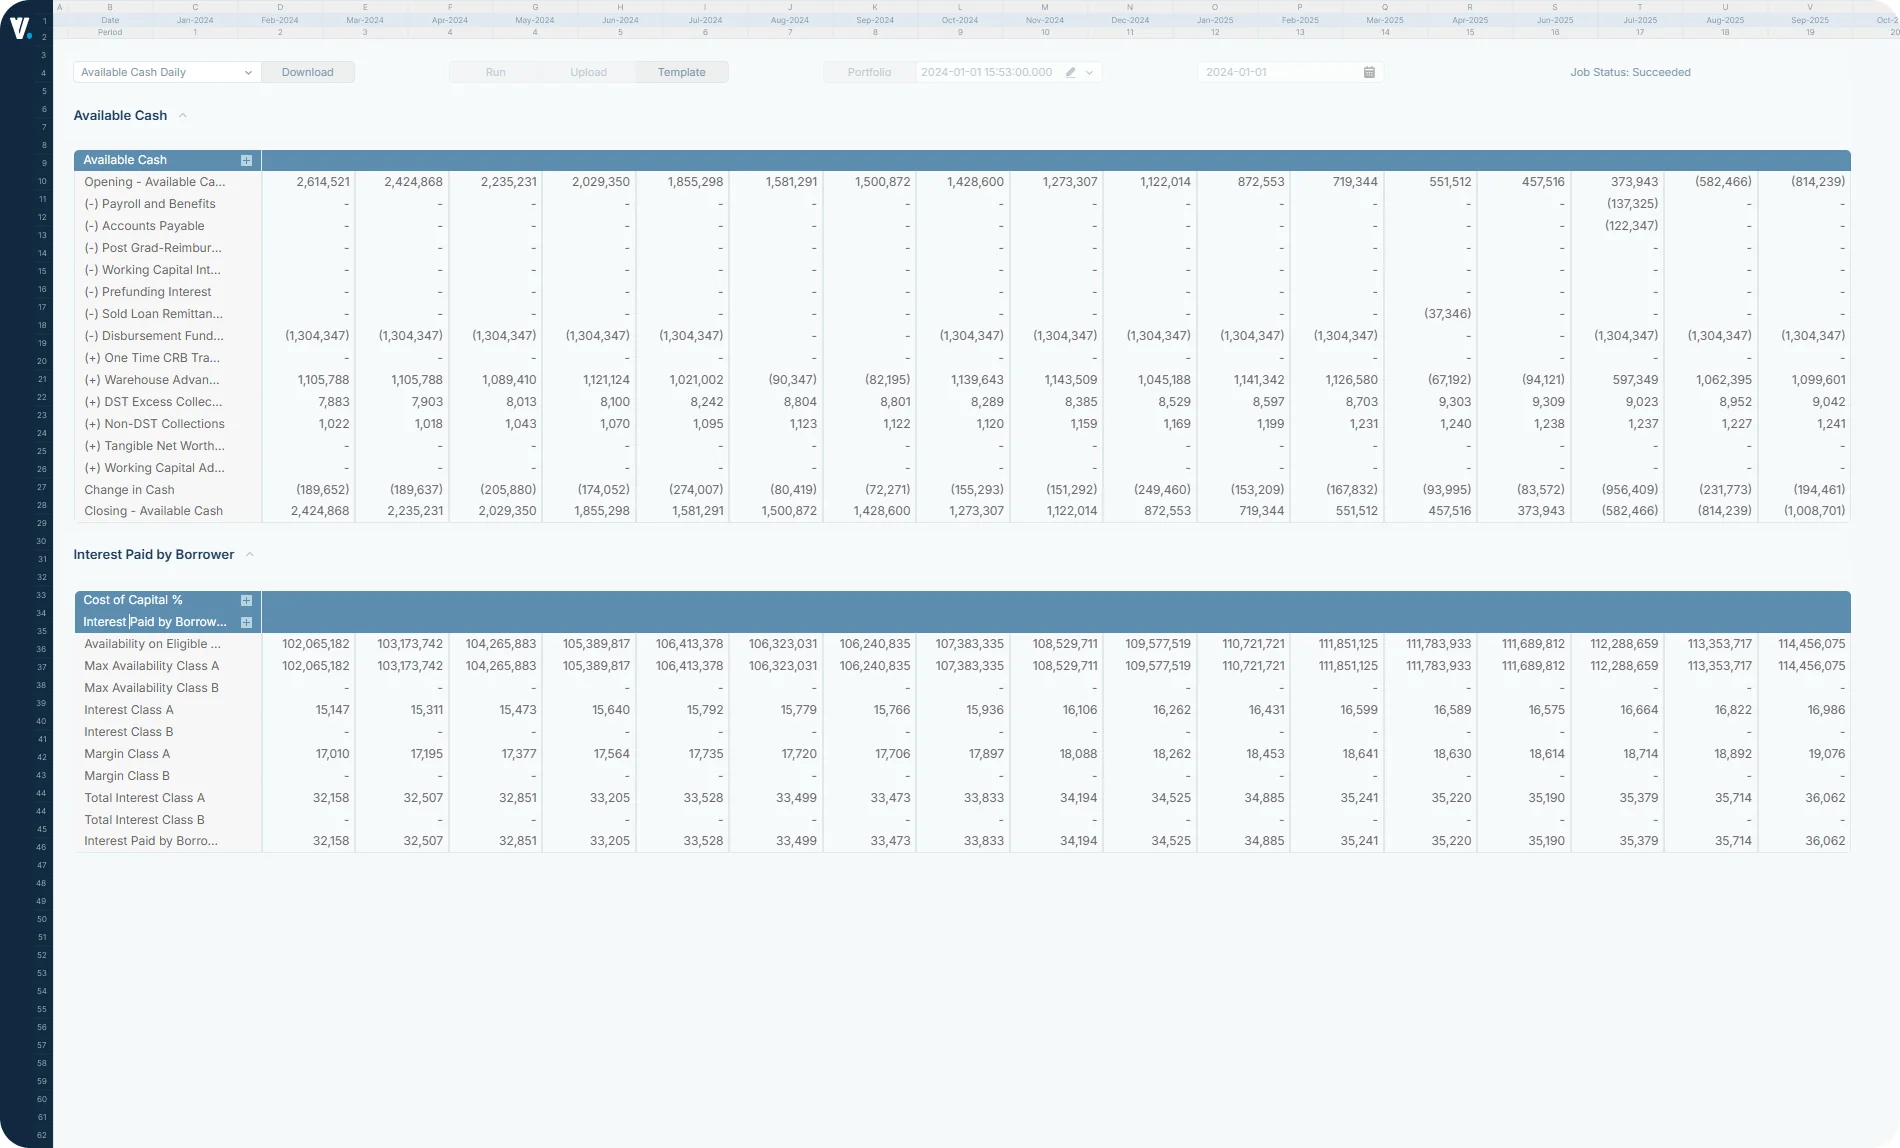
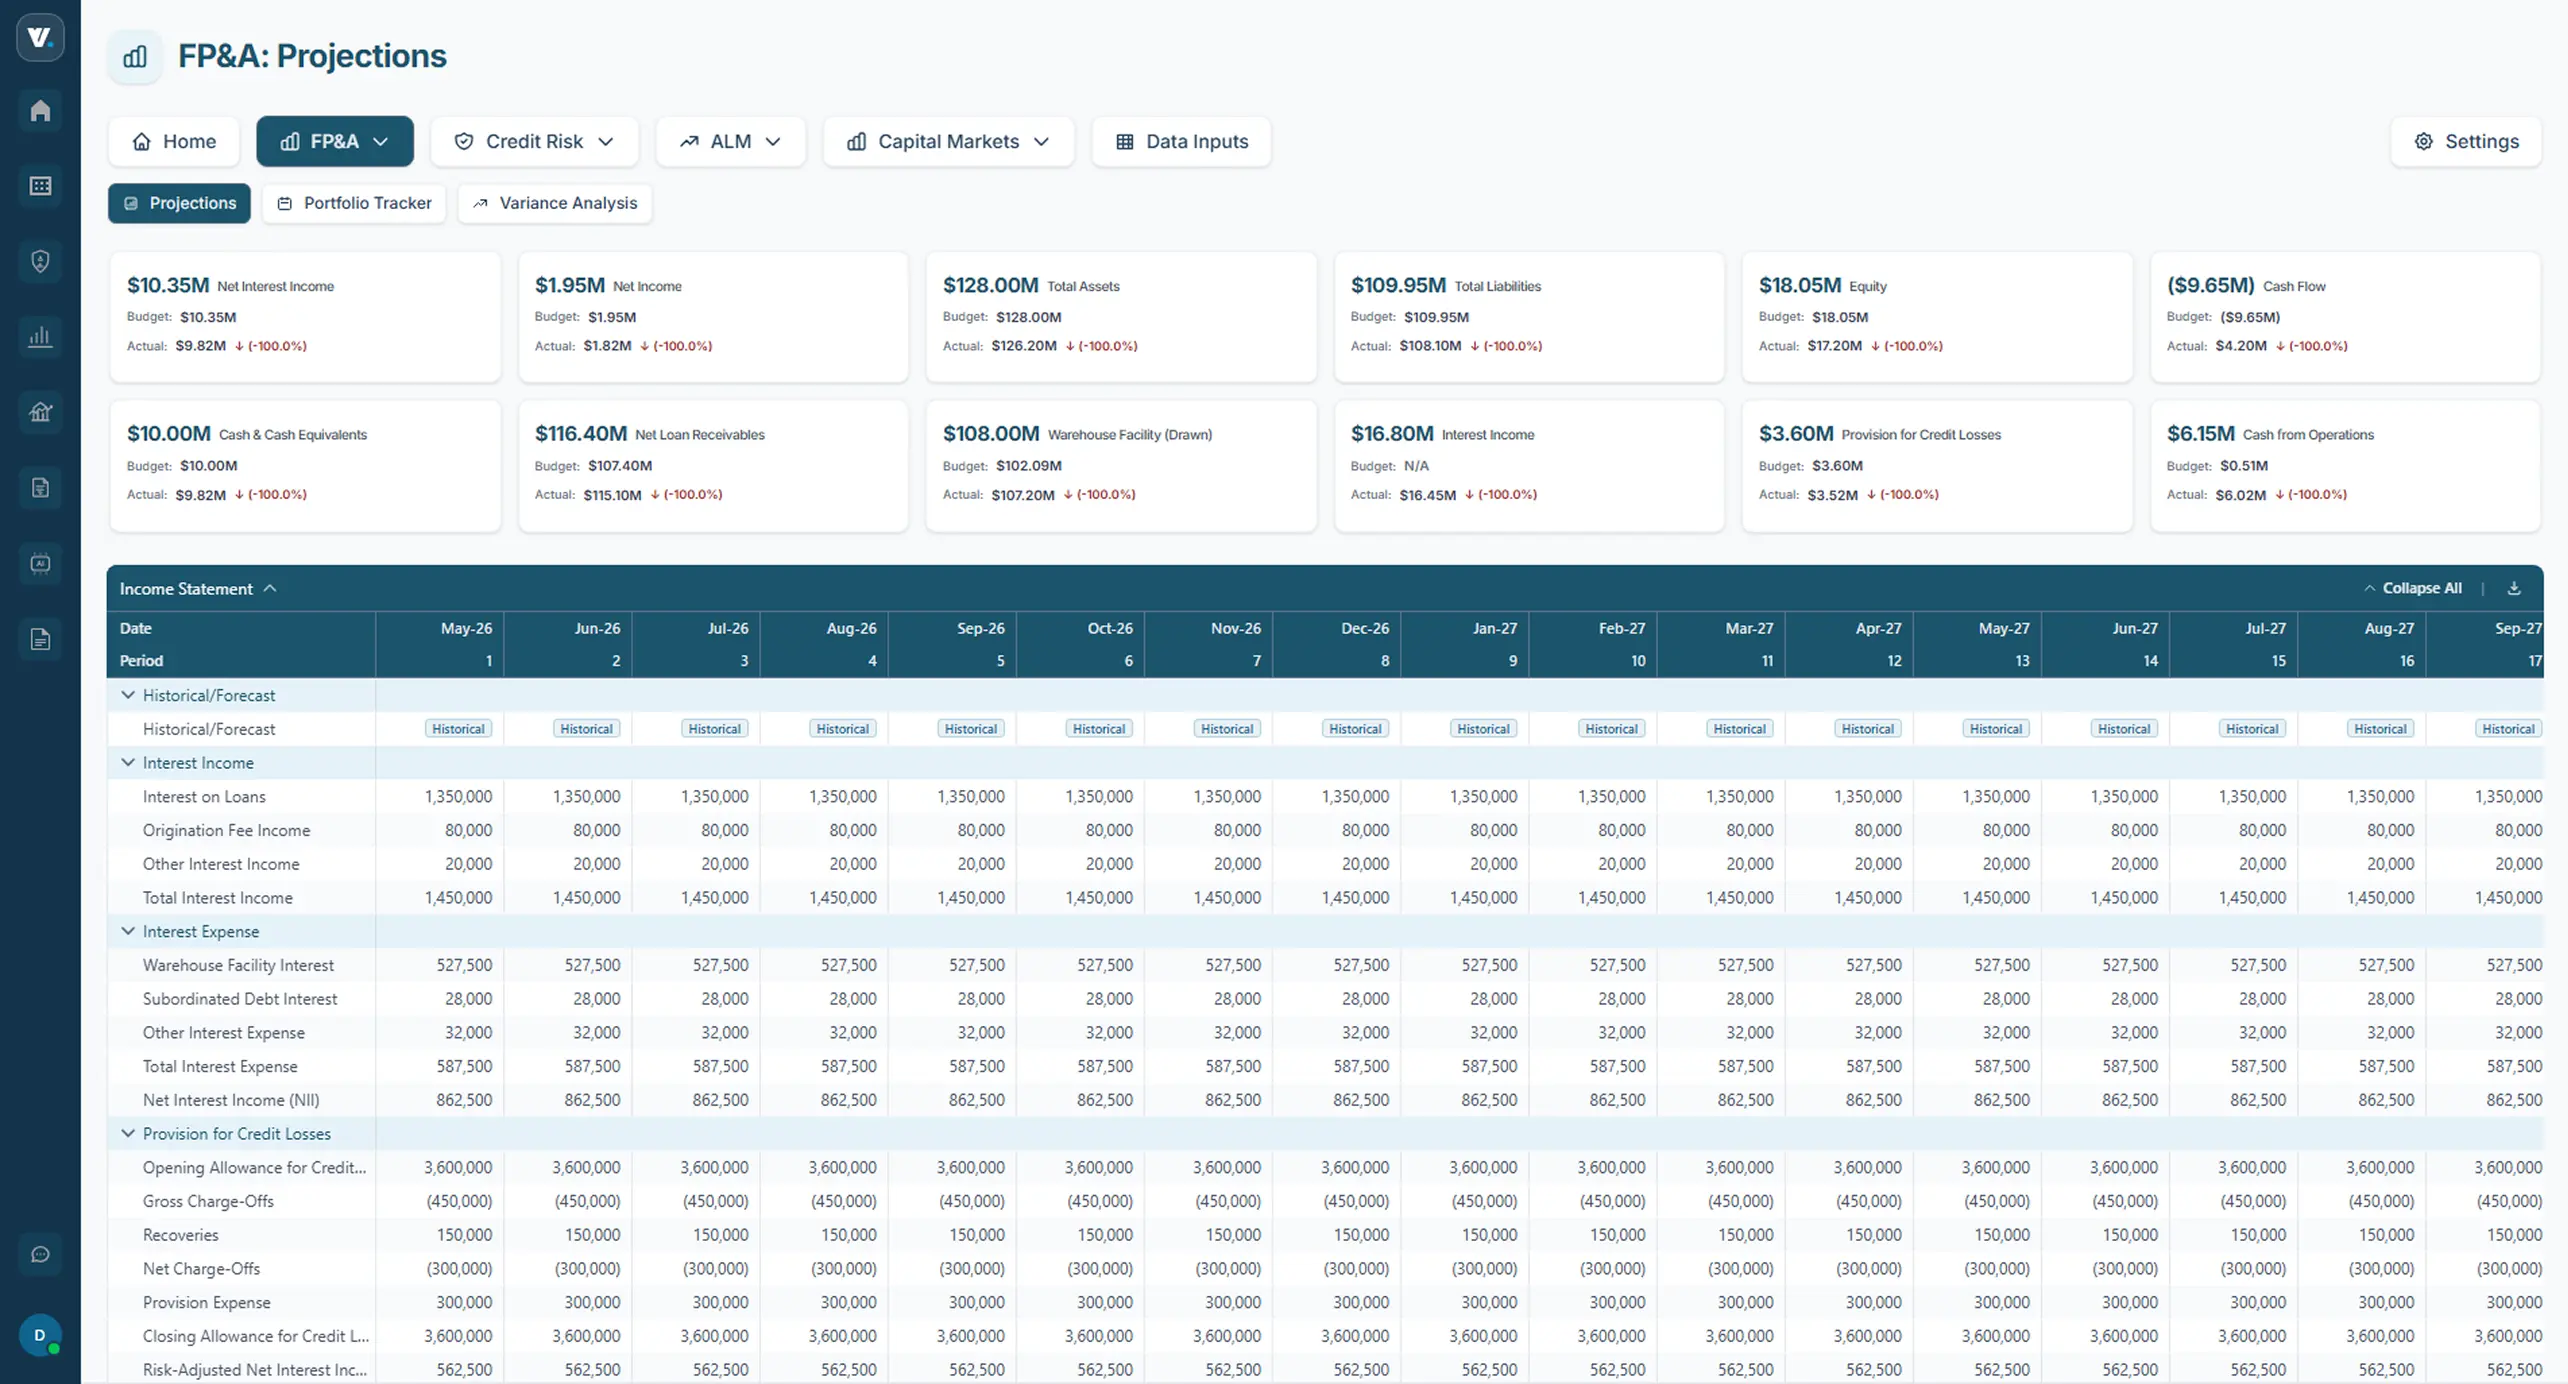
Integrated 3-Statement Model
Fully linked income, balance, and cash flow
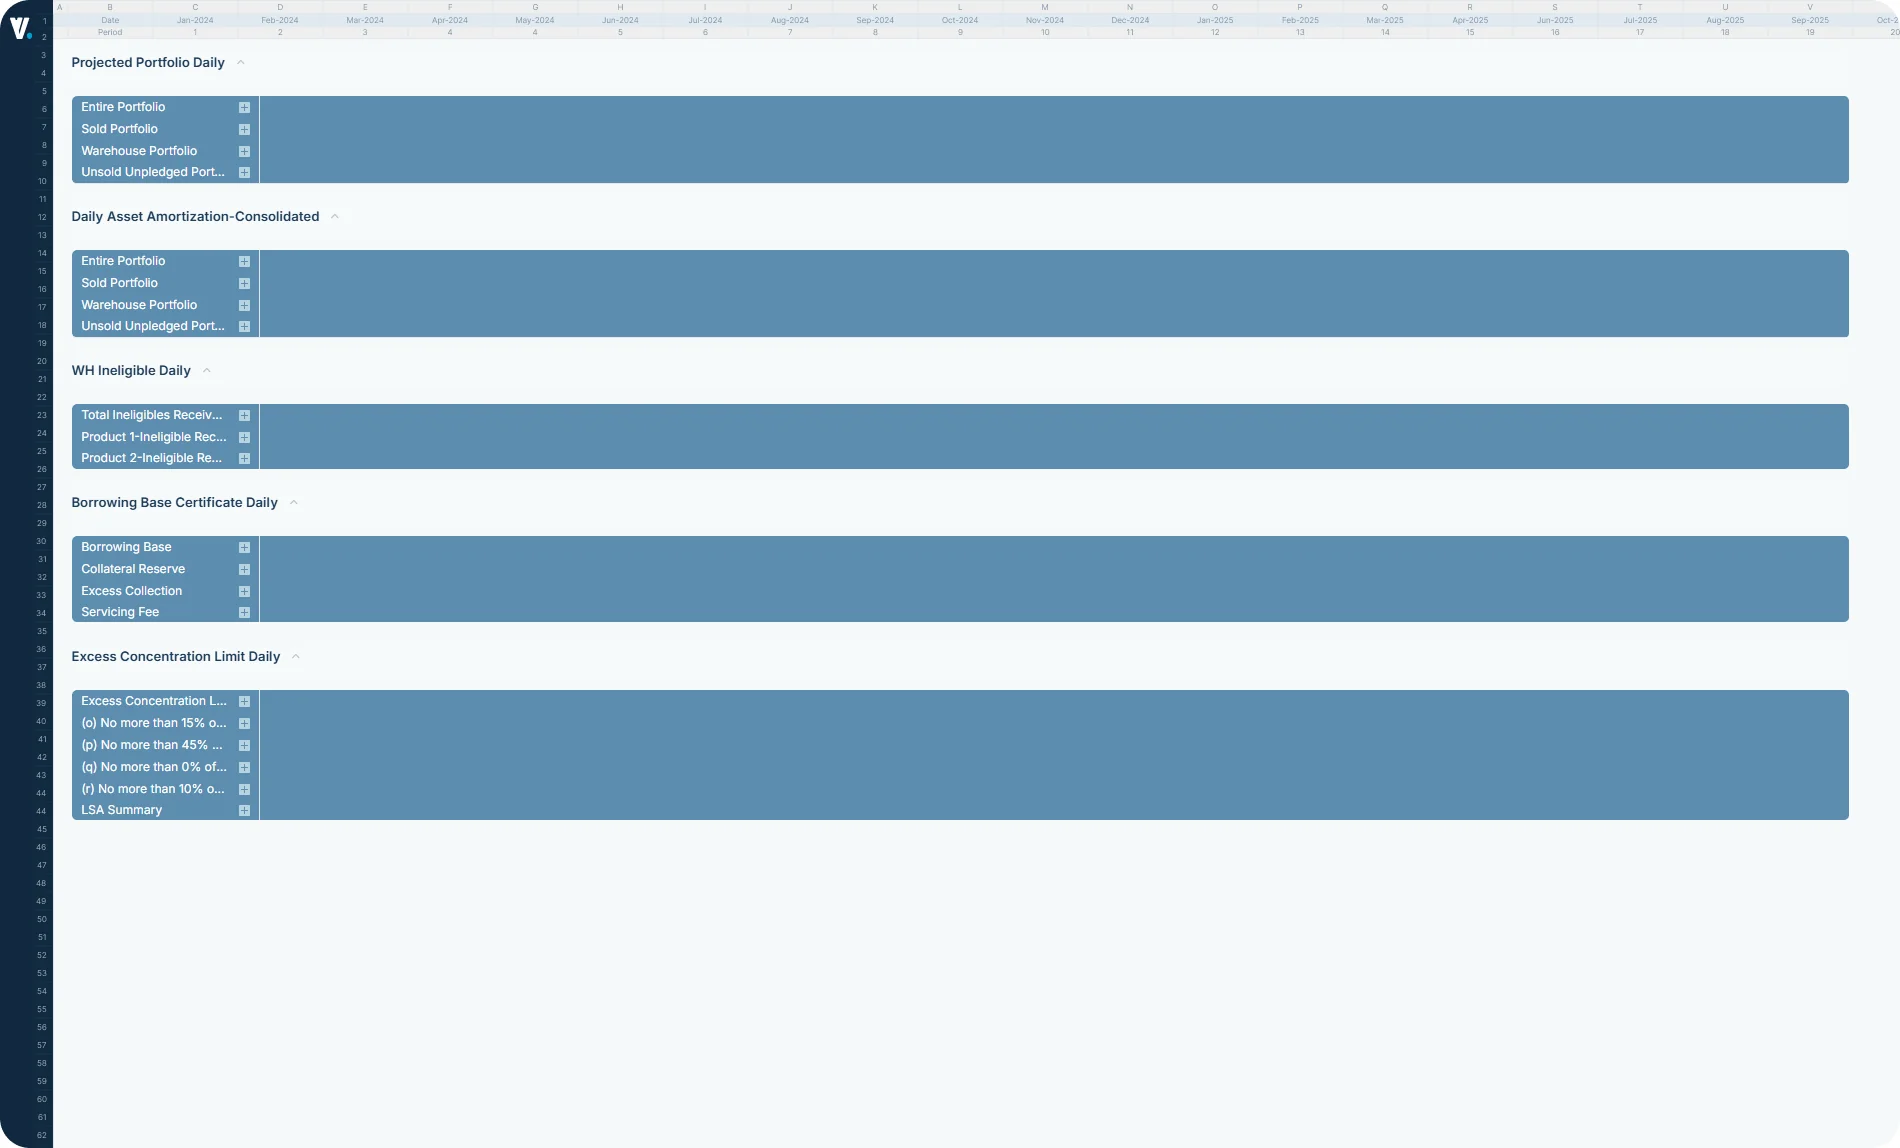
60-Period Forecasting
Extended horizon for strategic planning
Real-Time Calculations
Instant updates across all statements
Visual Analytics
Interactive charts and trend analysis
Power Your Financial Planning with Complete Visibility
Three-statement financial projections provide the foundation for strategic planning, capital allocation, and performance tracking. Our integrated modeling approach ensures consistency across income, balance sheet, and cash flow statements while automating complex calculations and interdependencies.
Accelerated Planning Cycles
Reduce budgeting and forecasting time by 70% with automated calculations and scenario modeling.
Improved Accuracy
Eliminate manual errors and ensure consistency across all financial statements with integrated data flow.
Strategic Decision Support
Make informed capital allocation and investment decisions with comprehensive financial projections.
Enhanced Stakeholder Communication
Present clear, professional financial forecasts to boards, investors, and management teams.
Regulatory Readiness
Maintain audit-ready documentation and support compliance reporting requirements.
Scalable Infrastructure
Handle growing complexity and data volumes without sacrificing performance or accuracy.
Demo Video Overview
See the platform in action — a quick walkthrough of Vector CFO
Latest Resources
Stay Informed With Our Latest Research And Articles